The aim of this study is to see if it is possible to predict genres of music based on the attributes of a song. As highlighted in Part 1, the potential applications of a model like this is extensive, as it can form the basis of a recommendation system or classification engine. Recommendation systems are used extensively, from media, where suggested films or music is displayed to the user based on what has been previously watched or listened to, to general retail where recommendations for additional products to purchase are based on previous purchases. Furthermore, classification is important in area such as spam email and fraud detection.
Consider the case of Apple Music and Spotify, each having 30mm songs in their databases respectively. With the number of successful independent artists increasing due to more democratized ways of gaining awareness of music (eg. YouTube, social media), the challenge to categorize information becomes ever more difficult. I plan to analyse song metadata, and lyrics where possible to see if it is possible to classify genres correctly.
Getting the data was a challenge, as there is only one major source of data, being the million song dataset. The Million Song Dataset is a freely-available collection of audio features and metadata for a million contemporary popular music tracks. The core of the dataset is the feature analysis and metadata for one million songs, provided by The Echo Nest. The dataset does not include any audio, only the derived features. The main issues with this dataset, are that it is 300gb big, and does not have any genre information. Furthermore, the company that provided this data has been bought out by Spotify, who subsequently made the Echo Nest API redundant. I tried to work with this data but the file format was in HDF5 format, which was heavily resource intensive to work with and process locally. I eventually tried a workaround by utilising a sql database which contained most of the metadata and was 300mb large.
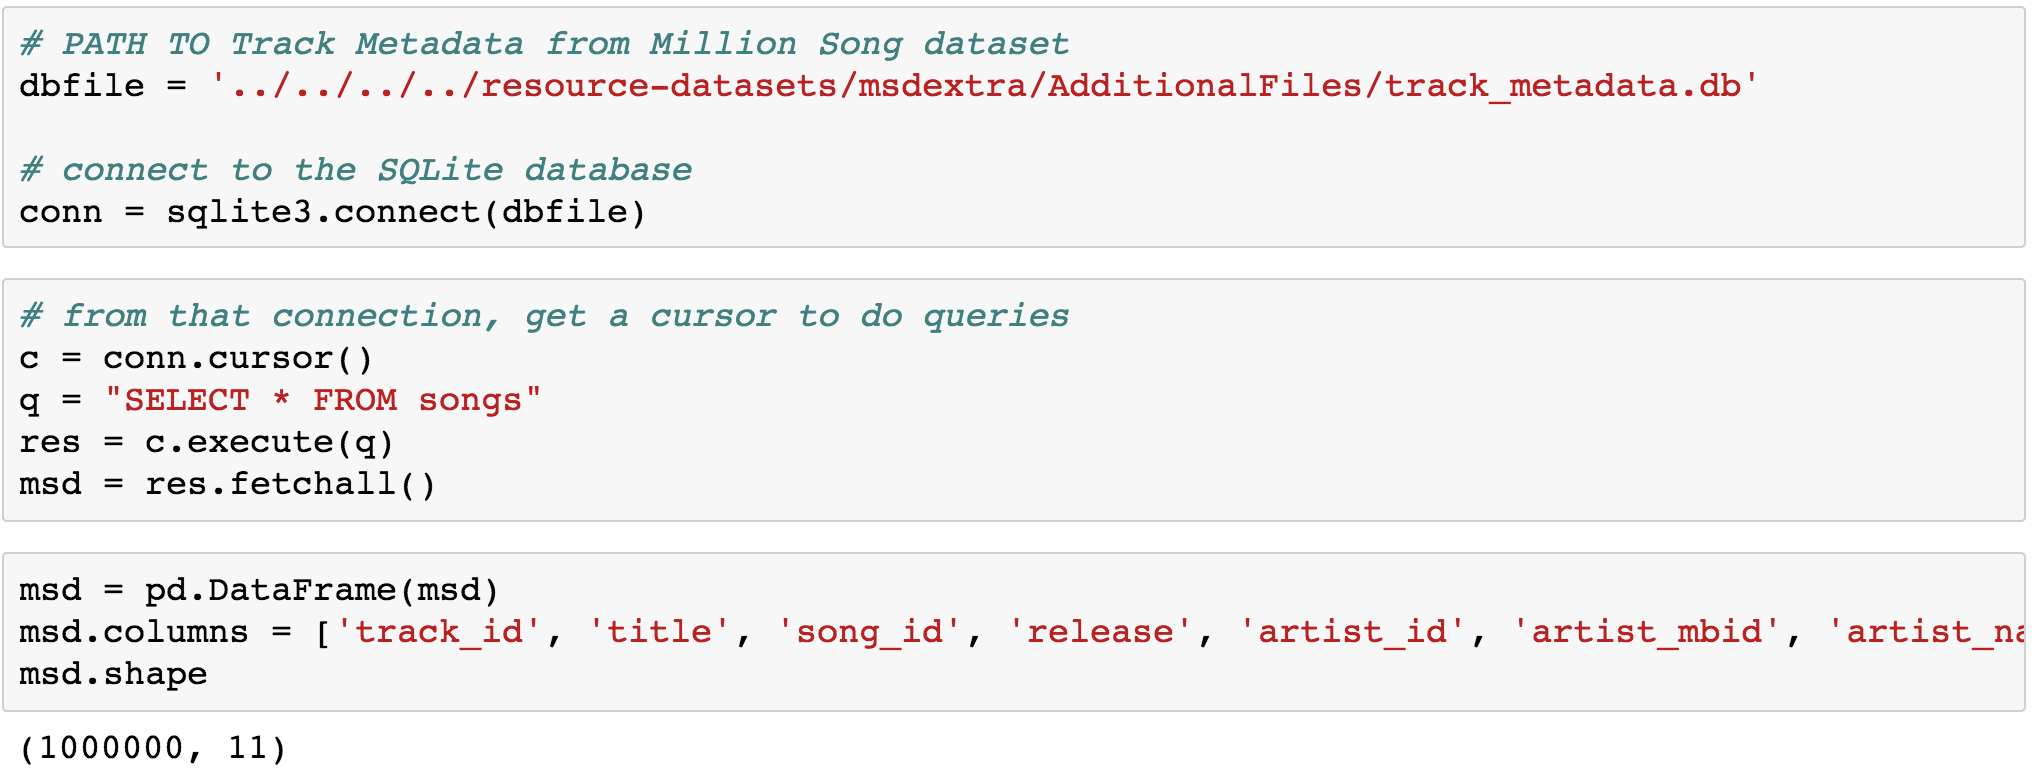
Following this, I managed to find another source which had labelled top level genres for a large percentage of this dataset. This was provided by Tagtrum, who had done extensive work on this dataset using various sources to annotate the original data supplied by the Echo Nest. I merged this with the original dataset, and used this to create a subset of the songs with the genre assignments. This was provided as a .cls file, which upon inspection appeared to be a tab delimited text file. Pandas has relatively little problem reading this type of file directly into a dataframe, as long as you specify that the file is tab delimited and there are no headers (I assigned them in the next step).

The Echo Nest ids were mapped to Spotify ids by a company called Acoustic Brainz . They have attempted to bring together all the various ids by all the online firms such as Pandora, Spotify, Musixmatch, Apple music etc. into one single database. These were listed by track in the Million Song Dataset, and were provided in json format. Python has a library that is able to read json files, and the format essentially looks like a dictionary, which, after you select the right elements, could be read into a list or dataframe. A sample file is displayed below:

Once all the data from the various datasets have been merged, the next step is to obtain the metadata for the relevant tracks via the spotify API. For this I had to create a developers account and cycle through the tracks in our table to get the relevant information. When I tried the first time, I got a throughput violation which caused a timeout on my requests. I was able to mitigate this by adding a sleep function between loops to slow down the code.

The final step is to merge everything together in a single dataframe in preparation for Exploratory Data Analysis:

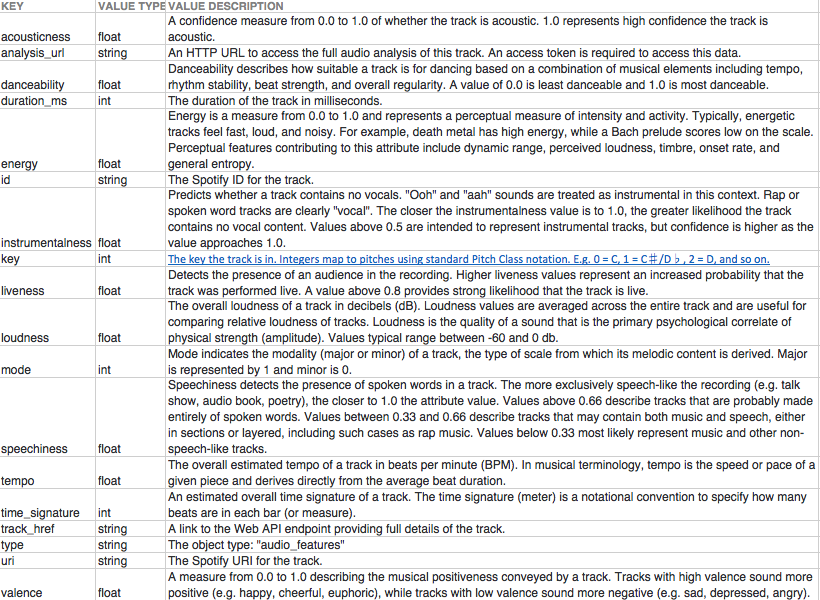
To get a quick recap of the features we have for analysis, a data dictionary is very useful to give a clearer interpretation of the relationships that may or may not be present.
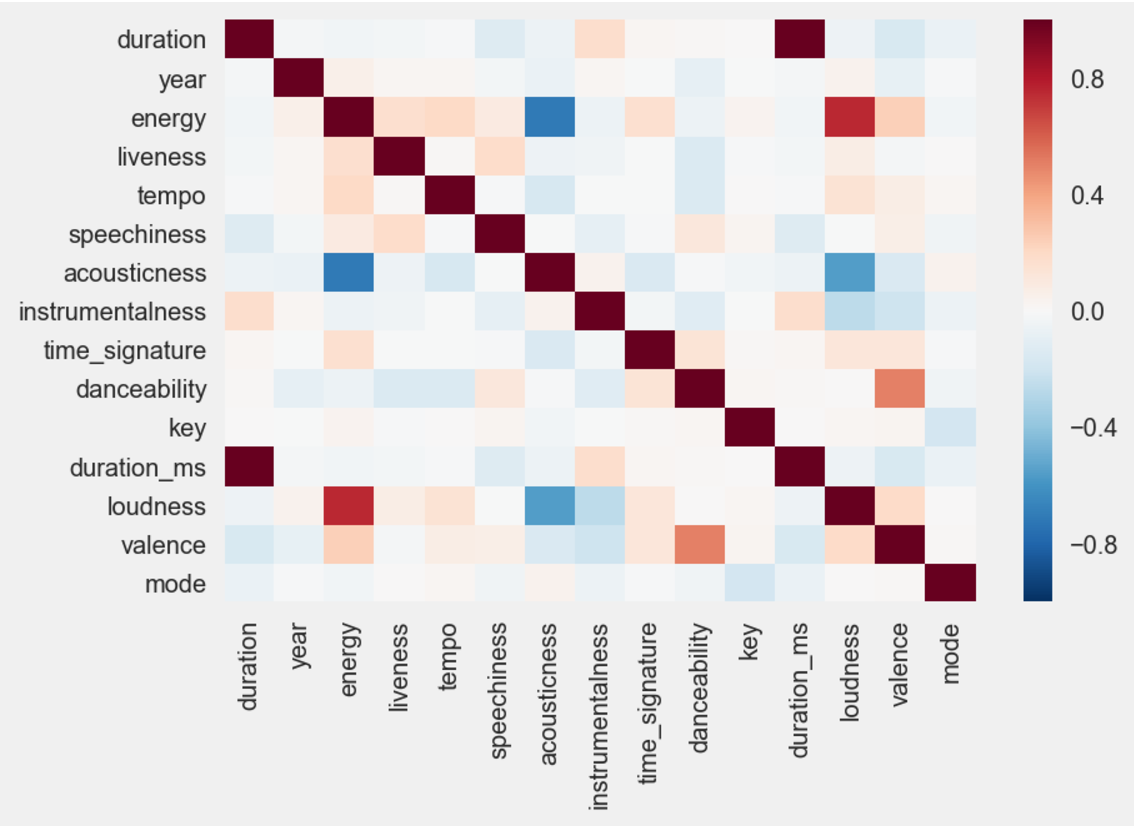
On the initial view of the correlation matrix, there do appear to be a few relationships which can be examined further. For example, energy and loudness has a positive correlation, which makes sense, if you could imaginr that the percieved energy of a track could be the strength of the track, which could also be depicted by loudness. In addition there seems to be a relationship between the valence ofa track and the danceability of a track. To recap, the valence of a track is the perceived mood of a track. A valence score of 1 represents a very positive mood track. As such, it could be deemed challenging to dance to a song which has a poor or negative mood associated with it.
Because of the number of observations present in this analysis, it becomes very difficult to plot this visually. As a result, I took a random sample of 100 observations to see if there is anything interesting that could be derived from this. given the number of features, it makes for difficult reading when you construct a pairplot of the entire dataset, but the most interesting scatter plots are provided below. The main takeaways are that most of the data appears quite skewed (in the sample) and there are general positive pairwise relationships between danceability and valence, energy and loudness, and energy and valence.
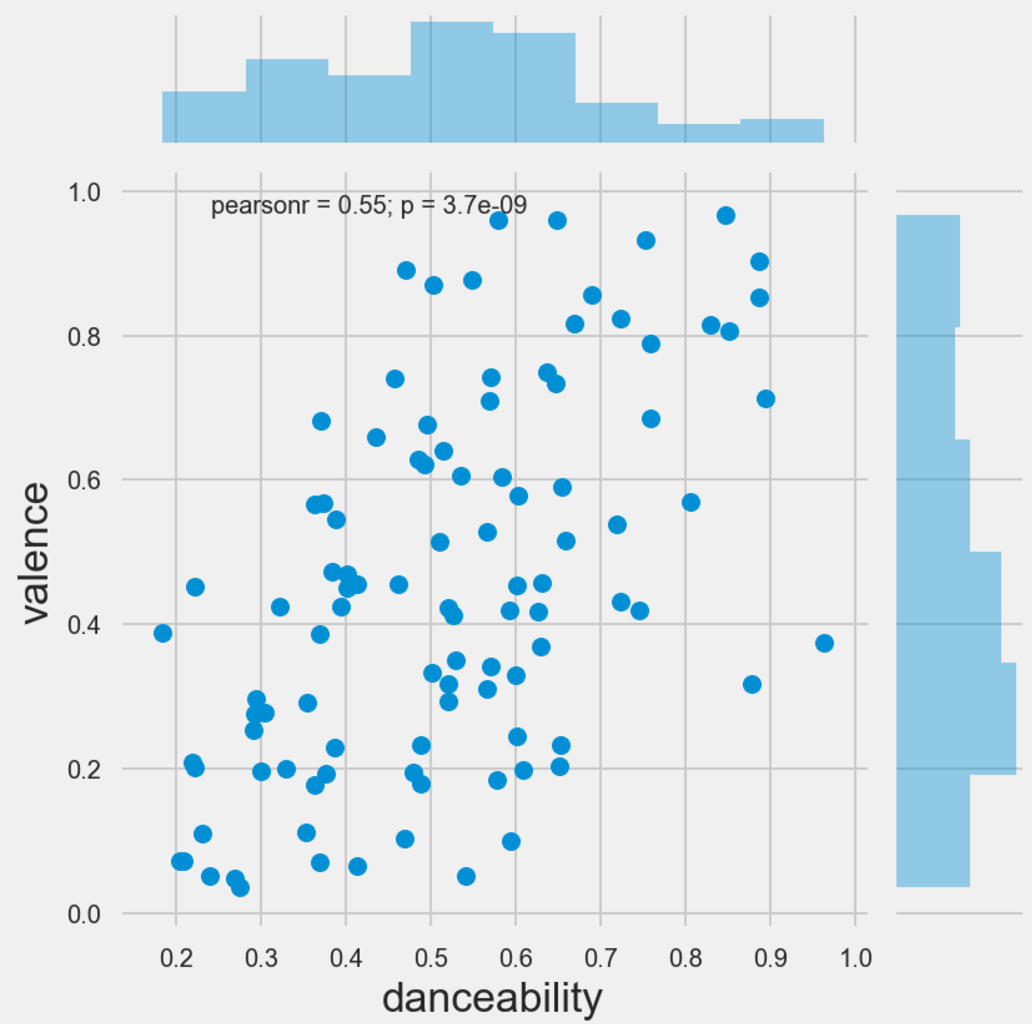
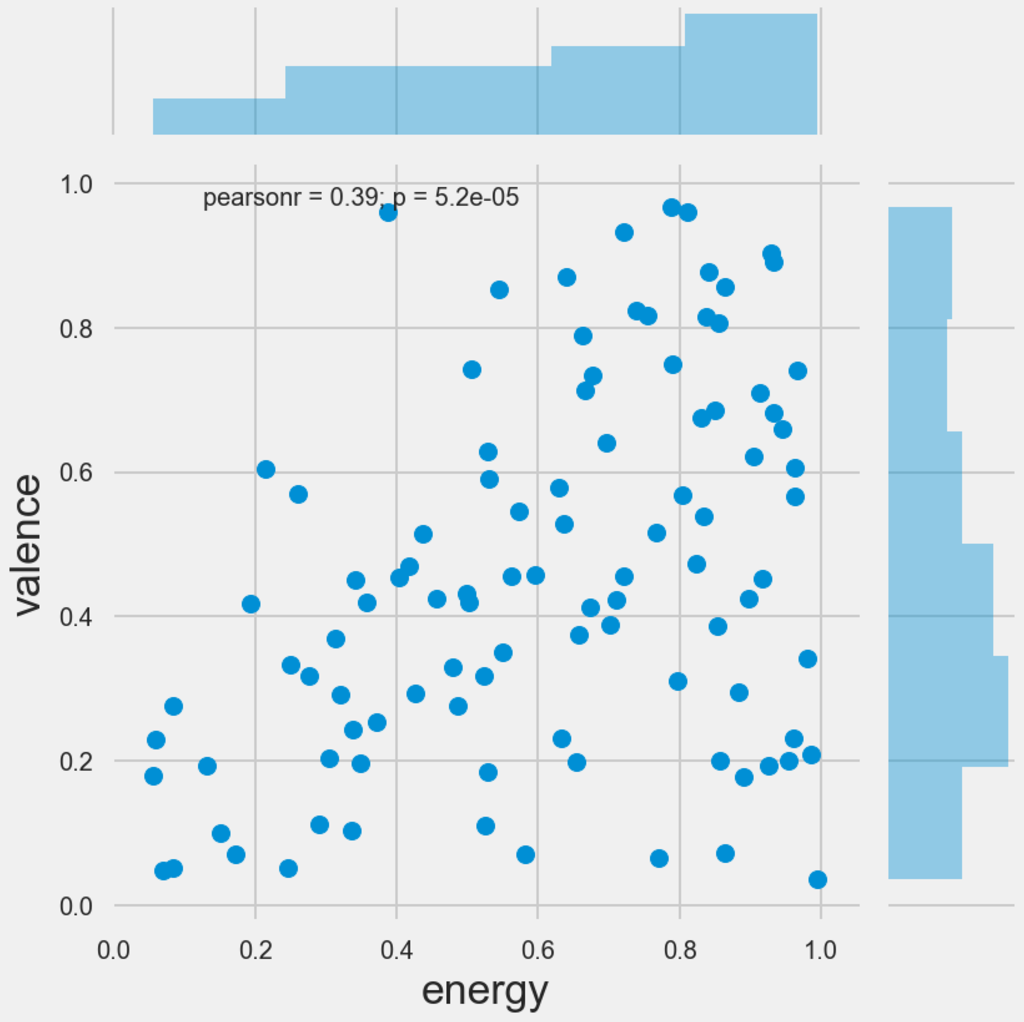
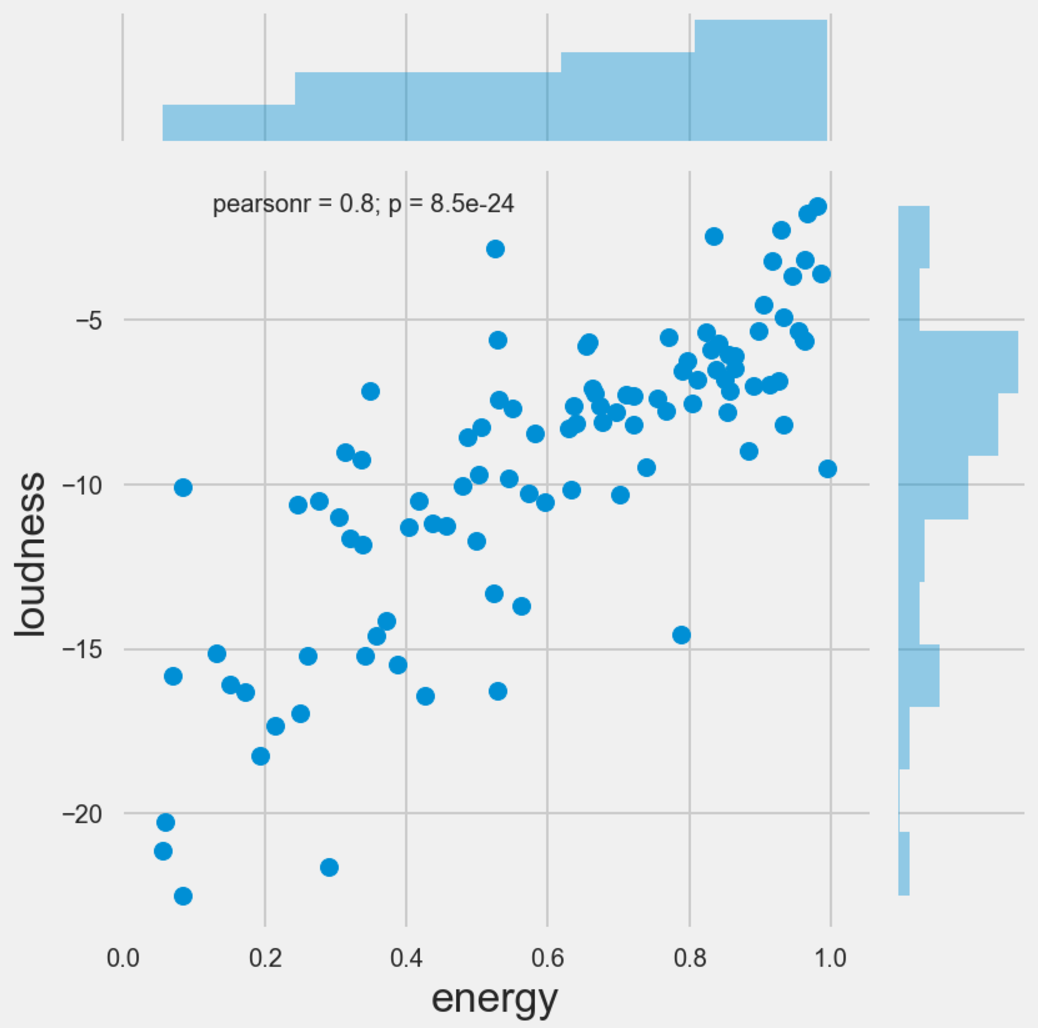
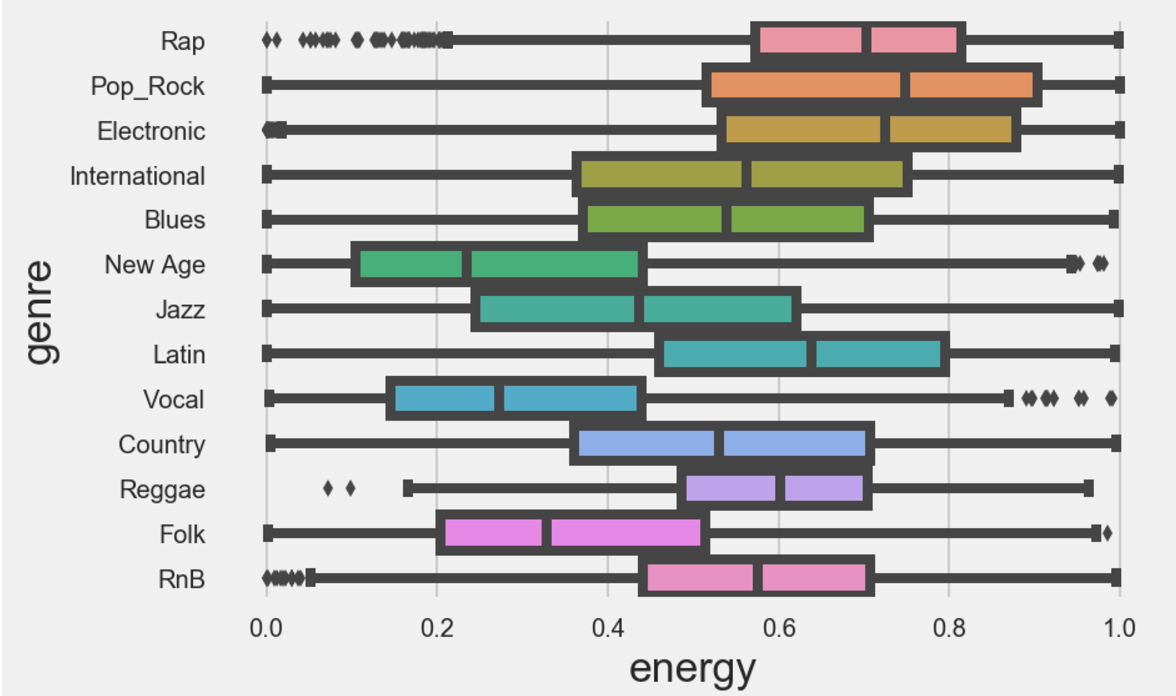
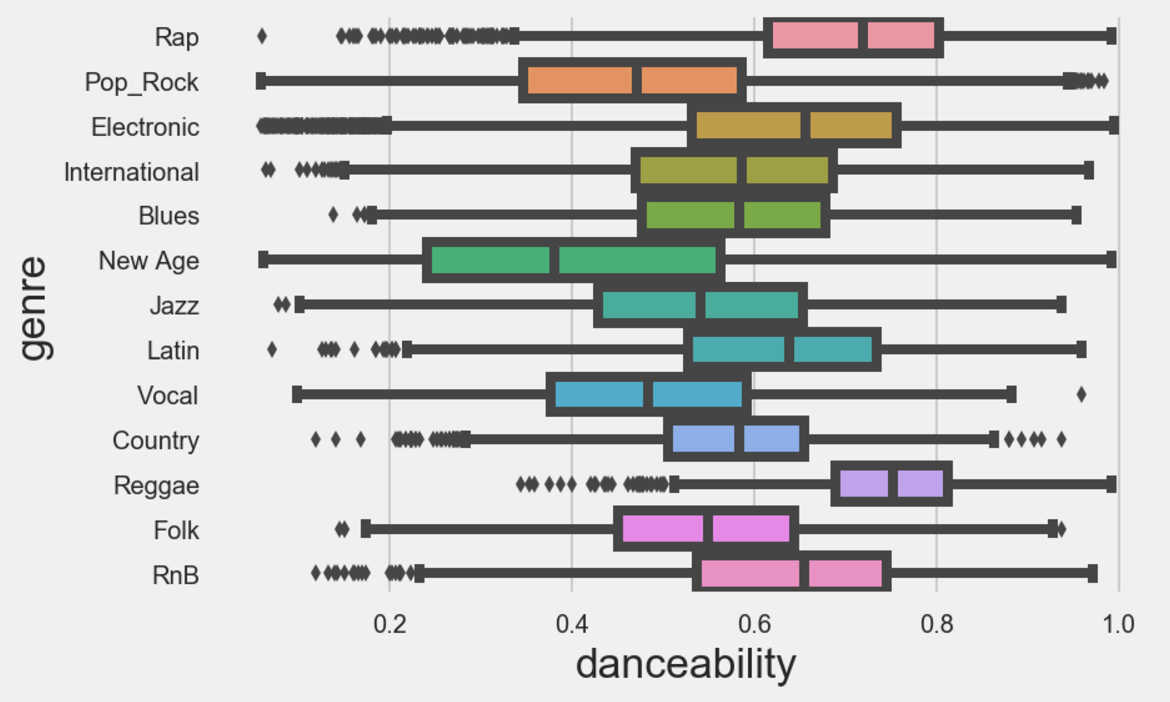
Finally, I looked to see if there are similar relationships between these features and the genres of music. This looked quite interesting, as for example when plotting energy against genre, pop and rock music scored high for energy, and folk music scored low, which is intuitive. Furthermore, Vocal music scored high on the acousticness scale, and rap and r&b scored well on the danceability scale.
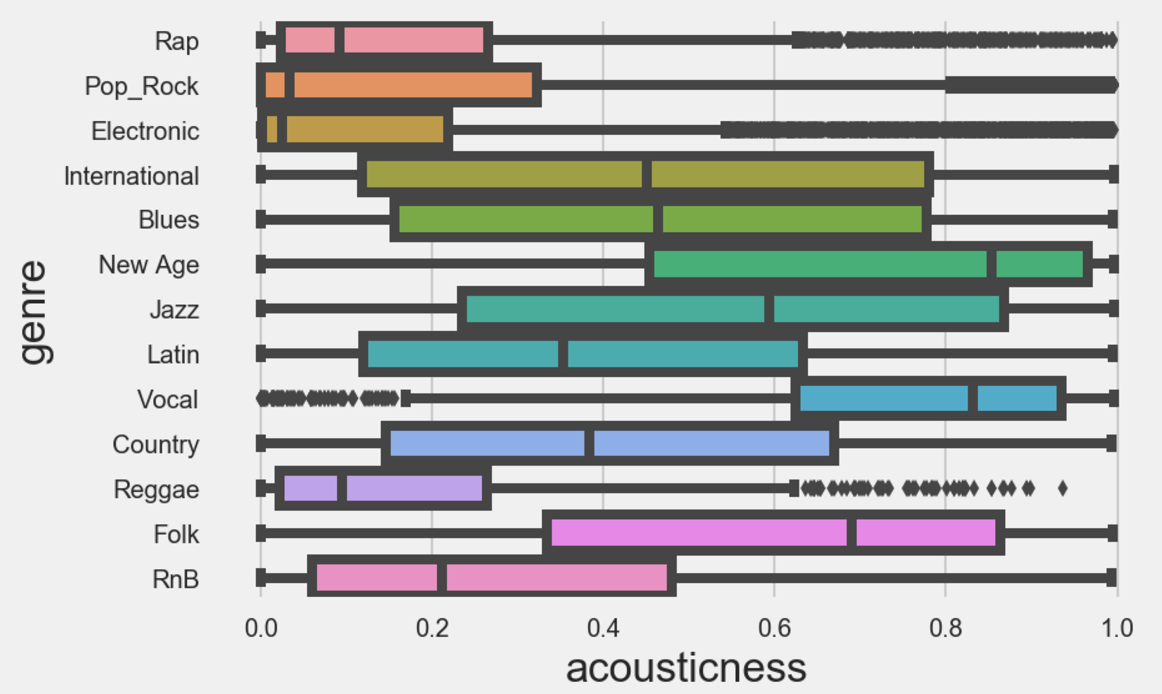
Thats all for now. If you are enjoying the read thus far, be sure to stay tuned for part 3, where we delve deep into the modelling, and actually see if we can predict some genres!
